It’s been a little over a year since our Redflow ZCell battery and Victron Energy inverter/charger kit were installed on our existing 5.94kW solar array. Now that we’re past the Southern Hemisphere spring equinox it seems like an opportune time to review the numbers and try to see exactly how the system has performed over its first full year. For background information on what all the pieces are and what they do, see my earlier post, Go With The Flow.
As we look at the figures for the year, it’s worth keeping in mind what we’re using the battery for, and how we’re doing it. Naturally we’re using it to store PV generated electricity for later use when the sun’s not shining. We are also charging the battery from the grid at certain times so it can be drawn down if necessary during peak times, for example I set up a small overnight charge to ensure there was power for the weekday morning peak, when the sun isn’t really happening yet, but grid power is more than twice as expensive. More recently in the winter months, I experimented with keeping the battery full with scheduled charges during most non-peak times. This involved quite a bit more grid charging, but got us through a couple of three hour grid outages without a hitch during some severe weather in August.
I spent some time going through data from the VRM portal for the last year, and correlating that with current bills from Aurora energy, and then I tried to compare our last year of usage with a battery, to the previous three years of usage without a battery. For reasons that will become apparent later, this turned out to be a massive pain in the ass, so I’m going to start by looking only at what we can see in the VRM portal for the past year.
The VRM portal has three summary views: System Overview, Consumption and Solar. System Overview tells us overall how much total power was pulled from the grid, how much was exported to the grid, how much was produced locally, and how much was consumed by our loads. The Consumption view (which I wish they’d named “Loads”, because I think that would be clearer) gives us the same consumption figure, but tells us how much of that came from the grid, vs. what came from the battery vs. what came from solar. The Solar view tells us how much PV generation went to the grid, how much went to the battery, and how much was used directly. There is some overlap in the figures from these three views, but there are also some interesting discrepancies, notably: the “From Grid” and “To Grid” figures shown under System Overview are higher than what’s shown in the Consumption and Solar views. But, let’s start by looking at the Consumption and Solar views, because those tell us what the system gives us, and what we’re using. I’ll come back after that to the System Overview, which is where things start to get weird and we discover what the system costs to run.
The VRM portal lets you chose any date range you like to get historical figures and bar charts. It also gives you pie charts of the last 24 hours, 7 days, 30 days and 365 days. To make the figures and bar charts match the pie charts, the year we’re analysing starts at 4pm on September 25, 2021 and ends at 4pm on September 25, 2022, because that’s exactly when I took the following screenshots. This means we get a partial September at each end of the bar chart. I’m sorry about that.
Here’s the Consumption view:
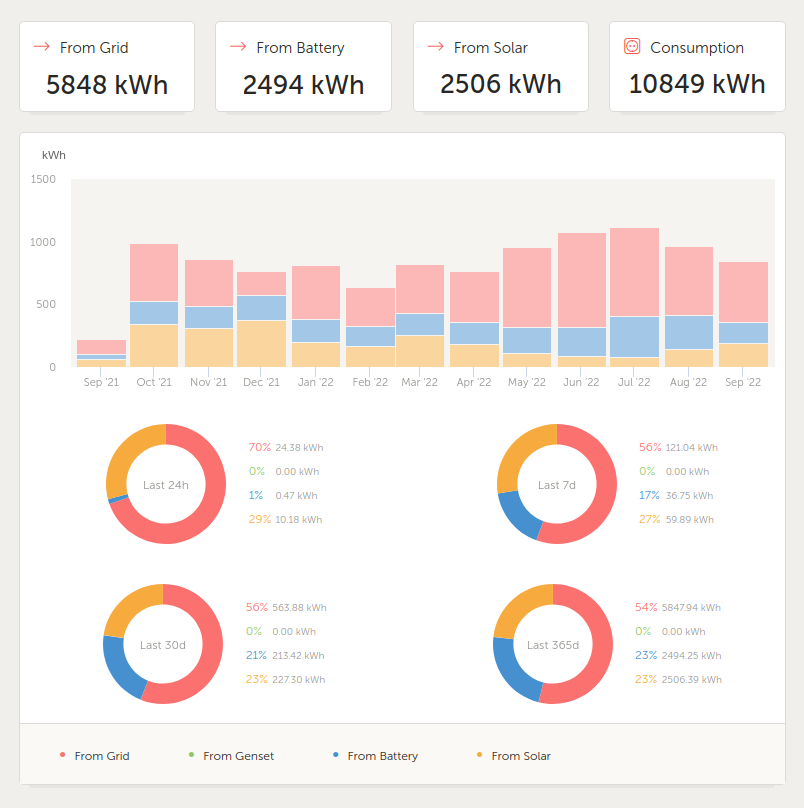
This shows us that in the last 12 months, our loads consumed 10,849kWh of electricity. Of that, 54% (5,848kWh) came from the grid, 23% (2,506kWh) came direct from solar PV and the final 23% (2,494kWh) came from the battery.
From the rough curve of the bar chart we can see that our consumption is lower in the summer months and higher in the winter months. I can’t say for certain, but I have to assume that’s largely due to heating. The low in February was 638kWh (an average of 22.8kWh/day). The high in July was 1,118kWh (average 36kWh/day).
Now let’s look at the Solar view:
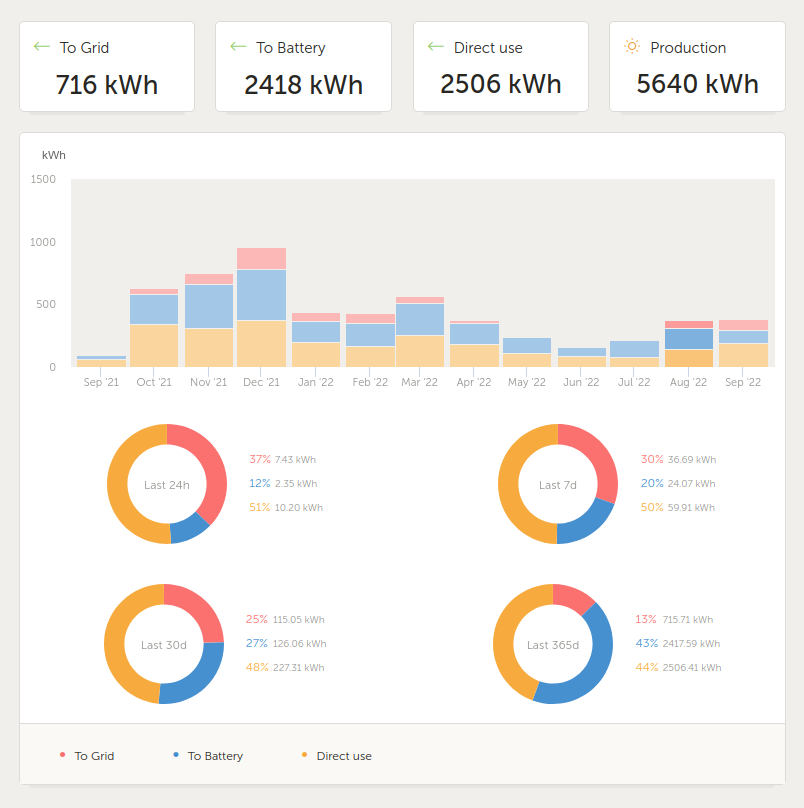
In that same time period we generated 5,640kWh with our solar array, of which 44% (2,506kWh) was used directly by our loads, 43% (2,418kWh) went into the battery and 13% (716kWh) was exported to the grid.
Unsurprisingly our generation is significantly higher in summer than in winter. We got 956kWh (average 30kWh/day) in December but only 161kWh (5.3kWh/day) in June. Peak summer figures like that mean we’ll theoretically be able to do without grid power at all during that period once we get a second ZCell (note that we’re still exporting to the grid in December – that’s because we’ve got more generation capacity than storage). The winter figures clearly indicate that there’s no way we can provide anywhere near all our own power at that time of year with our current generation capacity and loads.
Now look closely at the summer months (December, January and February). There should be a nice curve evident there from December to March, but instead January and February form a weird dip. This is because we were without solar generation for three weeks from January 20 – February 11 due to replacing a faulty MPPT. Based on figures from previous years, I suspect we lost 500-600kWh of potential generation in that period.
Another interesting thing is that if we compare “To Battery” on the Solar view (2,418kWh) with “From Battery” on the Consumption view (2,494kWh), we see that our loads consumed 76kWh more from the battery than we actually put into it with solar generation. This discrepancy is due to the fact that in addition to charging the battery from solar, we’ve also been charging it from the grid at certain times, but the amount of power sent to the battery from the grid isn’t broken out explicitly anywhere in the VRM portal.
Now let’s look at the System Overview:
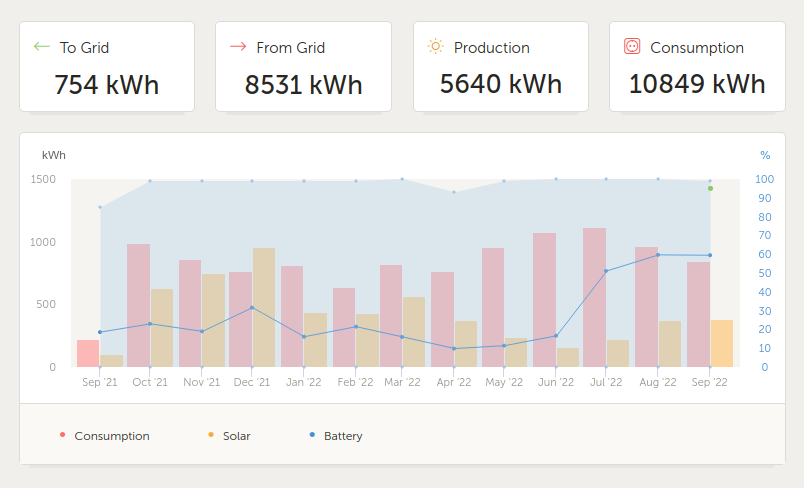
Here we see the same figures for “Production” (5,640kWh) and “Consumption” (10,849kWh) as were in the Consumption and Solar views, and the bar chart shows the same consumption and generation curves (ignore the blue overlay and line which indicate battery minimum/maximum and average state of charge – that information is largely meaningless at this scale, given we cycle the battery completely every day).
Now look at “To Grid” and “From Grid”. “To Grid” is 754 kWh, i.e. we somehow sent 38kWh more to the grid than came from solar. “From Grid”, at 8,531kWh, is a whopping 2,683kWh more than the 5,848kWh grid power consumed by our loads (i.e. close to half as much again).
So, what’s going on here?
One factor is that we’re charging the battery from the grid at certain times. Initially that was a few hours overnight and a few hours in the afternoon on weekdays, although the afternoon charge is obviously also provided by the solar if the sun is shining. For all of July, August and most of September though I was using a charge schedule to keep the battery full except for peak times and maintenance cycle nights, which meant quite a bit more grid charging overnight than earlier in the year, as well as grid charging most of the day during days with no or minimal sunshine. Grid power sent to the battery isn’t visible in the “From Grid” figure on the Consumption view – that view shows only our loads, i.e. the equipment the system is powering – but it is part of the “From Grid” figure in the System Overview.
Similarly, some of the power we export to the grid is actually exported from the battery, as opposed to being exported from solar generation. That usually only happens during maintenance cycles when our loads aren’t enough to draw the battery down at the desired discharge rate. But again, same thing, that figure is present here on the system overview page as part of “To Grid”, but of course is not part of the “To Grid” figure on the Solar view.
Another factor is that the system itself needs some amount of power to operate. The Victron kit (the MultiPlus II Inverter/Chargers, the Cerbo GX, the MPPT) use some small amount of power themselves. The ZCell battery also requires power to operate its pumps and fans. When the sun is out this power can of course come from solar. When solar power is not available, power to run the system needs to come from some combination of the remaining charge in the battery, and the grid.
On that note, I did a little experiment to see how much power the system uses just to operate. On July 9 (which happened to be a maintenance cycle day), I disabled all scheduled battery charges, and I shut off the DC isolators for the solar PV, so the battery would remain online (pumps and fans running) but empty for all of July 10. The following day I went and checked the figures on the System Overview, which showed we drew 35kWh, but that our consumption was 33kWh. So, together, the battery doing nothing other than running its pumps and fans, plus the Multis doing nothing other than passing grid power through, used 2kWh of power in 24 hours. Over a year, that’s 730kWh. As mentioned above, ordinarily some of that will be sourced from mains and some from solar, but if we look at the total power that came into the system as a whole (5,640kWh from solar + 8,531kWh from the grid = 14,171kWh), 730kWh is just slightly over 5% of that.
The final factor in play is that a certain amount of power is naturally lost due to conversion at various points. The ZCell has a maximum 80% DC-DC stack efficiency, meaning in the absolute best case if you want to get 10kW out of it, you have to put 12.5kW in. In reality you’ll never hit the best case: the lifetime charge and discharge figures the BMS currenly shows for our ZCell are 4,423 and 3,336kWh respectively, which is a bit over 75%. The Multis have a maximum efficiency of 96% when doing their invert/charge dance, so if we grid charge the battery, we lose at least 4% on the way in, and at least 4% on the way out as well, going to and from AC/DC. Again, in reality that loss will be higher than 4% each way, because 96% is the maximum efficiency.
A bunch of the stuff above just doesn’t apply to the previous system with the ABB inverter and no battery. I also don’t have anything like as much detailed data to go on for the old system, which makes comparing performance with the new system fiendishly difficult. The best comparison I’ve been able to come up with so far involves looking at total power input to the system (power from grid plus solar generation), total consumption by loads (i.e. actual locally usable power), and total power exported.
Prior to the Victron gear and Redflow battery installation, I had grid import and export figures from my Aurora Energy bills, and I had total generation figures from the ABB inverter. From this I can synthesise what are hopefully reasonably accurate load consumption figures by adding grid input to total PV generation minus grid export.
I had hoped to do this analysis on a quarterly basis to line up with Aurora bills, because then I would also be able to see how seasonal solar generation and usage went up and down. Unfortunately the billing for 2020 and 2021 was totally screwed up by the COVID-19 pandemic, because there were two quarters during which nobody was coming out to read the electricity meter. The bills for those quarters stated estimated usage (i.e. were wrong, especially given they estimated grid export as zero), with subsequent quarters correcting the figures. I have no way to reliably correlate that mess with my PV generation figures, except on an annual basis. Also, using billing periods from pre-battery years, the closest I can get to the September 25 based 2021-2022 year I’m looking at now is billing periods starting and ending in mid-August. But, that’s close enough. We’ve still got four pretty much back-to-back 12 month periods to look at.
| Year | Grid In | Solar In | Total In | Loads | Export |
|---|---|---|---|---|---|
| 2018-2019 | 9,031 | 6,682 | 15,713 | 11,827 | 3,886 |
| 2019-2020 | 9,324 | 6,468 | 15,792 | 12,255 | 3,537 |
| 2020-2021 | 7,582 | 6,347 | 13,929 | 10,358 | 3,571 |
| 2021-2022 | 8,531 | 5,640 | 14,171 | 10,849 | 754 |
One thing of note here is that in the 2018-2019 and 2019-2020 years, our annual consumption was pretty close to 12MWh, whereas in 2020-2021 and 2021-2022 it was closer to 10.5MWh. If I had to guess, I’d say that ~1.5MWh/year drop is due to a couple of pieces of computer equipment that were previously always on, now mostly running in standby mode except when actually needed. A couple of hundred watts constant draw is a fair whack of power over the course of a year. Another thing to note is the big drop in power exported in 2021-2022, because most of our solar generation is now used locally.
The thing that freaked me out when looking at these figures is that in the battery year, while our loads consumed 491kWh more than in the previous non-battery year, we pulled 949kWh more power in from the grid! This is the opposite of what I had expected to see, especially having previously written:
In the eight months the system has been running we’ve generated 4631kWh of electricity and “only” sent 588kWh to the grid, which means we’ve used 87% of what we generated locally – much better than the pre-battery figure of 45%. I suspect we’ve reduced the amount of power we pull from the grid by about 30% too, but I’ll have to wait until we have a full year’s worth of data to be sure.
– by me at the end of Go With The Flow
When I wrote that, I was looking at August 31, 2021 through April 27, 2022, and comparing that to the August 2020 to May 2021 grid power figures from my old Aurora bills. The mistake I must have made back then was to look at “From Grid” on the Consumption view, rather than “From Grid” on the System Overview. I’ve just done this exercise again, and the total grid draw from our Aurora bills from August 2020 to May 2021 is 4,980kWh. “From Grid” on the Consumption view for August 2021 to May 2022 is 3,575kWh, which is about 30% less, but “From Grid” on the System Overview is 4,754kWh, which is only about 5% less. So our loads pulled about 30% less from the grid than the same time the year before, but our system as a whole didn’t.
Now let’s break our ridiculous September-based year down further into months, to see if we can see more detail. I’ve highlighted some interesting periods in bold.
| Month | Grid In | Solar In | Total In | Loads | Export |
|---|---|---|---|---|---|
| Sep 21 (part) | 153 | 101 | 254 | 213 | 6 |
| Oct 21 | 636 | 629 | 1,265 | 988 | 55 |
| Nov 21 | 430 | 747 | 1,177 | 866 | 97 |
| Dec 21 | 232 | 956 | 1,188 | 767 | 176 |
| Jan 22 | 652 | 450 | 1,102 | 822 | 74 |
| Feb 22 | 470 | 430 | 900 | 638 | 83 |
| Mar 22 | 498 | 568 | 1,066 | 813 | 64 |
| Apr 22 | 609 | 377 | 986 | 775 | 27 |
| May 22 | 910 | 238 | 1,148 | 953 | 3 |
| Jun 22 | 1,114 | 161 | 1,275 | 1073 | 2 |
| Jul 22 | 1,163 | 223 | 1,386 | 1118 | 11 |
| Aug 22 | 910 | 375 | 1,285 | 966 | 64 |
| Sep 22 (part) | 754 | 385 | 1,139 | 857 | 92 |
| Total | 8,531 | 5,640 | 14,171 | 10,849 | 754 |
December is great. We generated about 25% more power than our loads use (956/767=1.25), and our grid input was only about 30% of the total of our loads (232/767=0.30).
January and February show the effects of missing three weeks of potential generation. I mean, just look at December through February 2021-2022 versus the previous three summers.
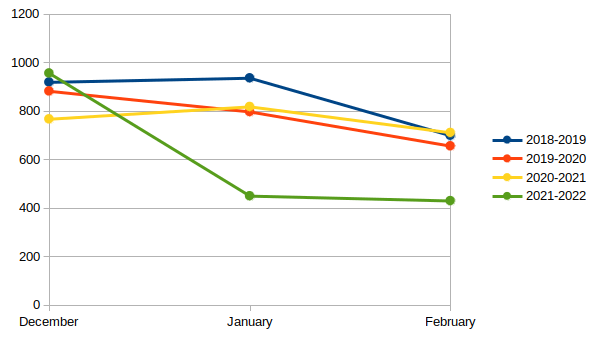
| 2018-2019 | 2019-2020 | 2020-2021 | 2021-2022 | |
|---|---|---|---|---|
| December | 919 | 882 | 767 | 956 |
| January | 936 | 797 | 818 | 450 |
| February | 699 | 656 | 711 | 430 |
June and July are terrible. They’re our highest load months, with the lowest solar generation and we pulled 3-4% more power from the grid than our loads actually consumed. I’m going to attribute the latter largely to grid charging the battery.
If I dig a couple of interesting figures out for June and July I see “To Battery” on the Solar view shows 205kWh, and “From Battery” on the Consumption view shows 558kWh. Total consumption in that period was 2,191kWh, with the total “From Grid” reported in System Overview of 2,277kWh. Let’s mess with that a bit.
Bearing in mind the efficiency numbers mentioned earlier, if 205kWh went to the battery from PV, that means no more than 154kWh of what we got out of the battery was from PV generation (remember: real world DC-DC stack efficiency of about 75%). The remaining 404kWh out of the battery is power that went into it from the grid. And that means at least 538kWh in (404/0.75). Note that total from grid for these two months was 86kWh more than the 2,191kWh used by our loads. If I hadn’t been keeping the battery topped up from the grid, I’d’ve saved at least 134kWh of grid power, which would have brought our grid input figure back down below our consumption figure. Note also that this number will actually be higher in reality because I haven’t factored in AC/DC conversion losses from the Multis.
Now let’s look at some costs. When I started trying to compare the new system to the previous system, I went in thinking to look at in in terms of total power input to the system, total consumption by loads, and total power exported. There’s one piece missing there, so let’s add another couple of columns to an earlier table:
| Year | Grid In | Solar In | Total In | Loads | Export | Total Out | what? |
|---|---|---|---|---|---|---|---|
| 2021-2022 | 8,531 | 5,640 | 14,171 | 10,849 | 754 | 11,603 | 2,568 |
The total usable output of the system was 11,603kWh for 14,171kWh input. The difference between these two figures – 2,568kWh, or about 18% – went somewhere else. Per my earlier experiment, 5% is power that went to actually operate the system components, including the battery. That means about 13% of the power input to the system over the course of the year must have gone to some combination of charge/discharge and AC/DC conversion (in)efficiencies. We can consider this the energy cost of the system. To have the ability to time-shift expensive peak grid electricity, and to run the house without the grid if the sun is out, or from the battery when it has charge, costs us 18% of the total available energy input.
Grid power has energy costs too, but we’re not usually aware of this because it happens somewhere else. I haven’t yet found Tasmanian figures, but this 2021 Transmission Annual Planning Report PDF from Powerlink in Queensland has historical figures showing that about 7% of generation there went to auxiliaries, i.e. fans and pumps and things running at the power stations. And according to the Australian Energy Market Operator (AEMO), 10% of grid power generated is lost during transmission and distribution. Stanwell (a power company in Queensland) have a neat explainer of all this on their What’s Watt site.
Finally, speaking of expensive grid electricity, let’s look at how much we paid Aurora Energy over the past four years for our power. The bills are broken out into different tariffs, for which you’re charged different amounts per kilowatt hour and then there’s an additional daily supply charge, and also credits for power exported. We can simplify that by just taking the total dollar value of all the power bills and dividing that by the total power drawn from the grid to arrive at an effective cost per kilowatt hour for the entire year. Here it is:
| Year | From Grid | Total Bill | Cost/kWh |
|---|---|---|---|
| 2018-2019 | 9,031 | $2,278.33 | $0.25 |
| 2019-2020 | 9,324 | $2,384.79 | $0.26 |
| 2020-2021 | 7,582 | $1,921.77 | $0.25 |
| 2021-2022 | 8,531 | $1,731.40 | $0.20 |
So, the combination of the battery plus the switch from Flat Rate to Peak & Off-Peak billing has reduced the cost of our grid power by about 20%. I call that a win.
Going forwards it will be interesting to see how the next twelve months go, and, in particular, what we can do to reduce our power consumption. A significant portion of our power is used by a bunch of always-on computer equipment. Some of that I need for my work, and some of that provides internet access, file storage and email for us personally. Altogether, according to the UPSes, this kit pulls 200-250 watts continuously, but will pull more than that during the day when it’s being used interactively. If we call it 250W continuous, that’s a minimum of 6kWh/day, which is 2,190kWh/year, or about 20% of the 2021-2022 consumption. Some of that equipment should be replaced with newer, more power efficient kit. Some of it could possibly even be turned off or put into standby mode some of the time.
We still need to get a heat pump to replace the 2400W panel heater in our bedroom. That should save a huge amount of power in winter. We’re also slowly working our way through the house installing excellent double glazed windows from Elite Double Glazing, which will save on power for heating and cooling year round.
And of course, we still need to get that second ZCell.